我的作品 JAVA 三维可视化组件:Matplot 3D for JAVA(V3.0) 一个纯 JAVA 开发的科学数据可视化组件包 JAVA 环境类似 Mathplotlib 的库
概述
Matplot3D for JAVA(V3.0)是一个基于 JAVA SE 1.8 环境开发的三维图形图表组件。 组件由纯 JAVA SE 实现(Pure Java),封装为一个 jar 包,jar 文件大小不超过 300KB。内含自主研发的三维几何造型、绘制算法,无需依赖 OpenGL、DriectX、JAVA 3D 或 JAVAFX 等等第三方库,其只依托 JRE 自带的类库即可(即只需安装了 JAVA 就可使用),可以非常方便的将 Matplot3D for JAVA(V3.0) 显示面板嵌入到自己 JAVA GUI 程序中,或者生成图片用于 Web 动态页面中。
本组件提供简单的外观 API,可以方便生成三维效果的图形图表。可用于大数据可视化、科学数据分析可视化等领域。在使用 GUI 显示时支持鼠标等输入设备交互式操作,可方便的缩放和改变观察角度。支持动态编程,可实时生成三维模型动态改变动画。也可以根据输入的数据直接生成图片文件,这可用于动态 Web 的服务端,从页面传入的数据生成图像文件,返回给页面显示。
组件下载及项目地址:
码云: https://www.gitee.com/tanling8334/Matplot3D-for-Java
Github: https://github.com/tanling8334/Matplot3D-for-Java
完整 API 请参看上面连接中的 Readme.md 文档,其中的 demo 结尾的.jar 文件是可执行文件,实际开发使用时不需要引用。请在安装了 64 位 java 的系统中运行,运行 demo 可以看到实际效果和示例代码。实测在 JAVA8 和 JAVA17 上使用效果较好。欢迎大家推广使用和交流。
作者联系方式:
email : ta8334@126.com QQ : 17746302
效果展示:
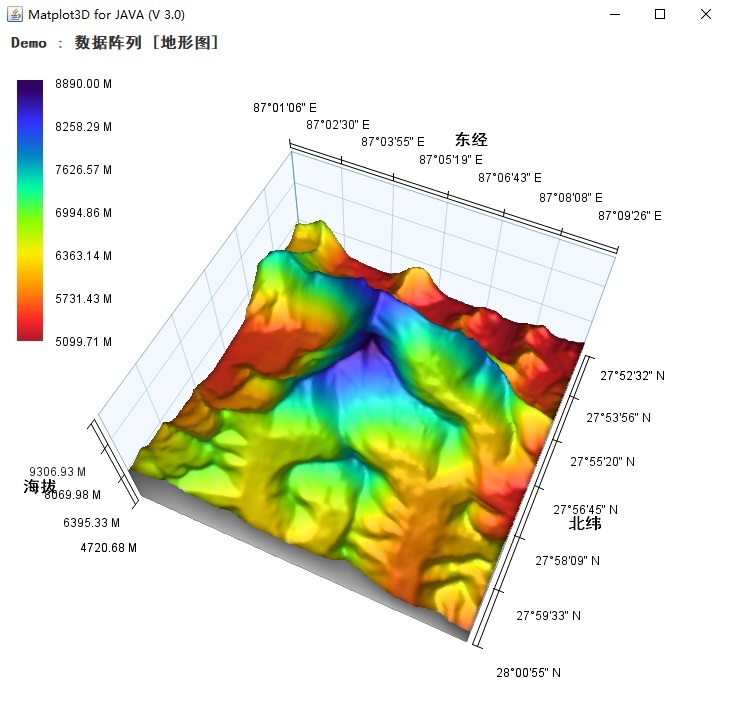
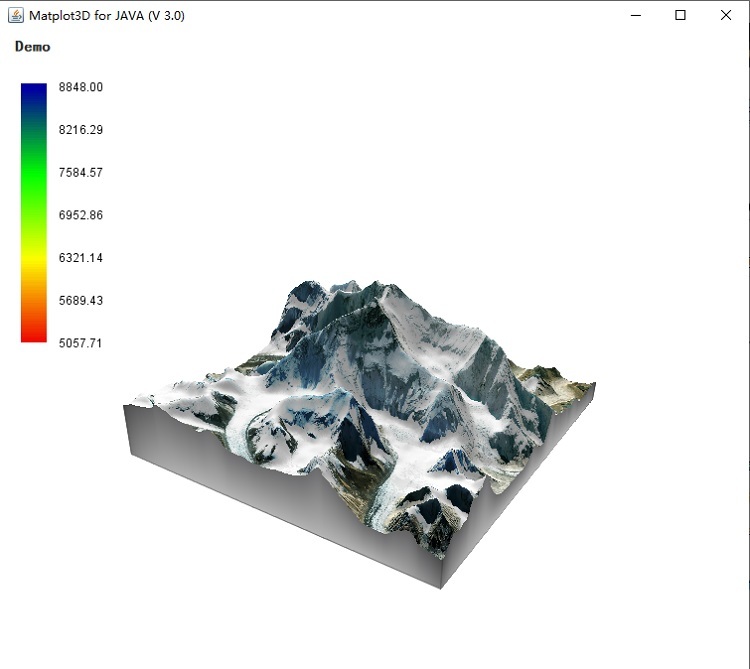
地形数据可视(动图)
引擎功能展示 地球(动图)
引擎功能展示 珠峰(动图)
数据阵列:
数据阵列示例代码:
import java.util.Random;

import tanling.matplot3d.app.facade.DataGridProcessor;
import tanling.matplot3d.app.facade.Matplot3D4JMgr;
import tanling.matplot3d.common.Range;
import tanling.matplot3d.d3d.color_style.ColorStyle;
import tanling.matplot3d.d3d.color_style.TopBottomColorStyle;

public class DataGridDemo {
    public static void main(String[] args) {
        DataGridProcessor processor = new DataGridProcessor();

        final Matplot3D4JMgr mgr=new Matplot3D4JMgr(processor);

        //=======================================
        //准备你的数据,是一个二维Double数组。表示均匀分布的网格点,数组内的值表示高度
        //数据一般来源于具体应用的非规则函数数据,例如某区域的DEM地形高程数据
        //以下代码创造一些虚拟数据用于展示如何使用

        Double[][] datas=new Double[20][20];

        Random random=new Random();

        for(int i=0;i<datas.length;i++) {
            for(int j=0;j<datas[0].length;j++) {

                if(i+j<20)
                    datas[i][j]=(double)i+j+random.nextDouble();
                else
                    datas[i][j]=40d-i-j-random.nextDouble();

            }
        }
        //=======================================


        //创建一个颜色风格
        ColorStyle cs = new TopBottomColorStyle(ColorStyle.DEFAULT_COLORS_ARRAY);

        mgr.setCoordianteSysShowType(Matplot3D4JMgr.COORDINATE_SYS_ALWAYS_FURTHER);

        processor.setClose3DObject(true);//设置是否是封闭三维对象

        mgr.setScaleX(1);
        mgr.setScaleY(1);
        mgr.setScaleZ(1.2);

        mgr.setTitle("Demo 数据阵列");

        processor.setShowGrid(false);//是否现显示辅助网格线

        processor.addData(datas, "", new Range(0, 100), new Range(100, 200), 20, 20, cs, 1f);

        mgr.show();
    }
}
点云 :

引擎功能展示 珠峰
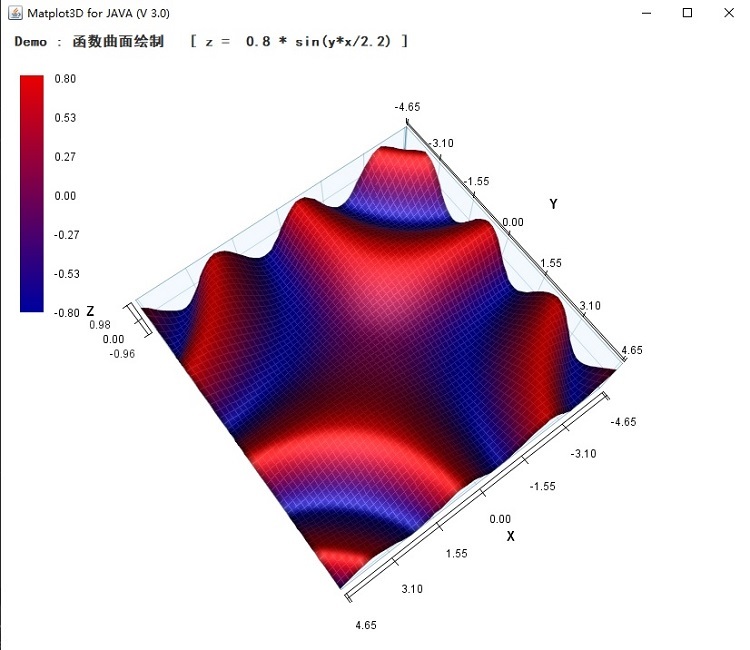
函数曲面:
函数曲面示例代码
import tanling.matplot3d.app.facade.Function;
import tanling.matplot3d.app.facade.FunctionProcessor;
import tanling.matplot3d.app.facade.Matplot3D4JMgr;
import tanling.matplot3d.common.Range;

public class FunctionSurfaceDemo {

    public static void main(String[] args) {

        FunctionProcessor processor = new FunctionProcessor();

        final Matplot3D4JMgr mgr=new Matplot3D4JMgr(processor);

        //定义二维函数,根据xy值求y值
        Function f = new Function() {
            public Double f(double x, double y) {
                return Math.sin(y * x / 2.2) * 0.8;
            }
        };

        double pi = Math.PI;

        //将二维函数加入处理器,设置XY方向显示范围和采样分段数
        //可以加入多个函数
        processor.addData(f, "", new Range(-1.5*pi, 1.5*pi), new Range(-1.5*pi, 1.5*pi), 60, 60);

        mgr.setScaleZ(1.5);
        mgr.setScaleX(1.3);
        mgr.setScaleY(1.3);

        mgr.setSeeta(1.3);
        mgr.setBeita(1.1);

        mgr.setTitle("Demo : 函数曲面绘制   [ z =  0.8 * sin(y*x/2.2) ]");

        mgr.setCoordianteSysShowType(mgr.COORDINATE_SYS_ALWAYS_FURTHER);

        mgr.show();
    }
}
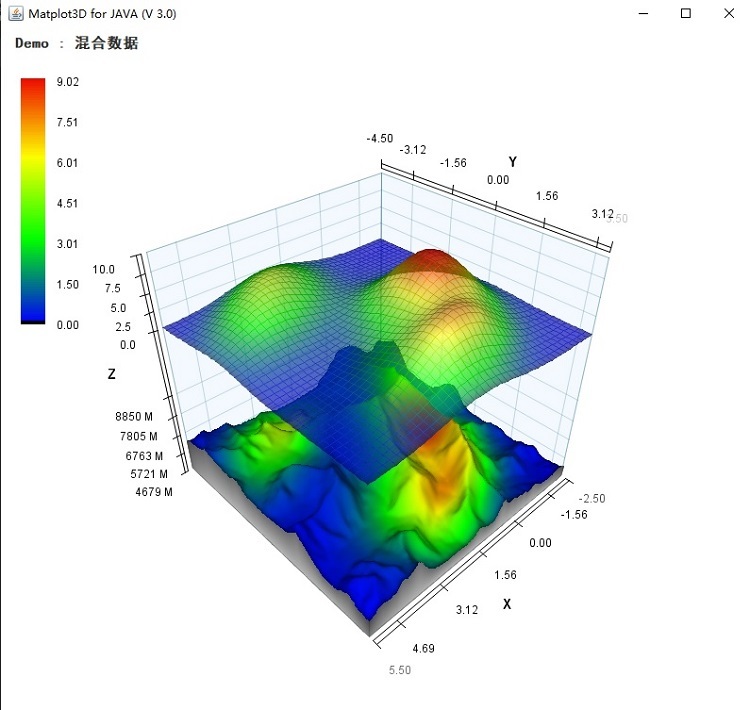
混合数据:
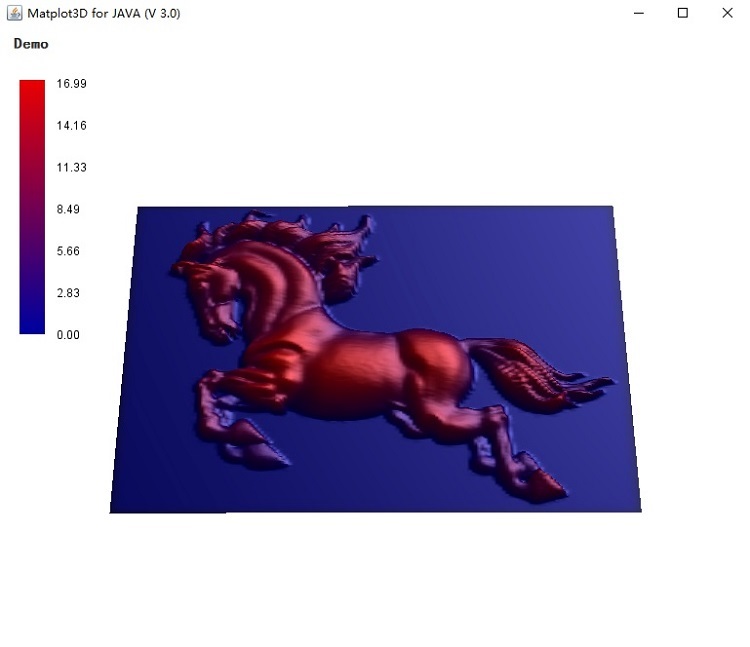
浮雕效果:
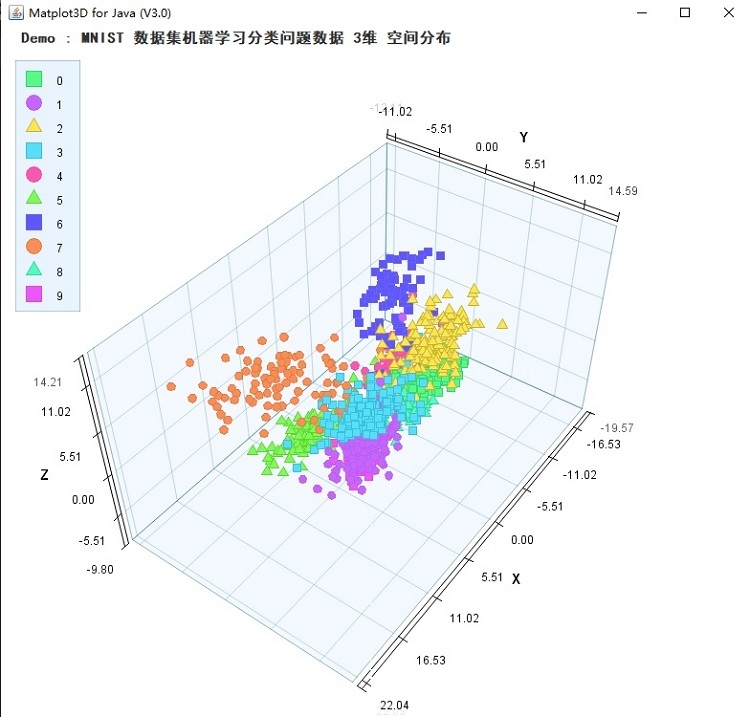
散点
云图:
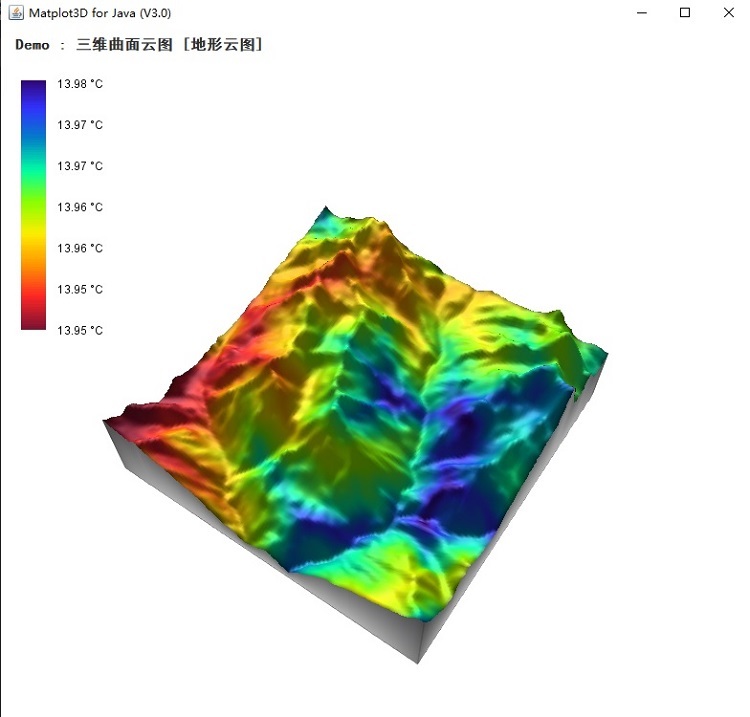
云图示例代码
import java.awt.Color;
import java.util.Random;

import tanling.matplot3d.app.facade.ContourDataGridProcessor;
import tanling.matplot3d.app.facade.Matplot3D4JMgr;
import tanling.matplot3d.common.Range;

public class ContourDataGridDemo {
    public static void main(String[] args) {

        ContourDataGridProcessor processor = new ContourDataGridProcessor();

         Matplot3D4JMgr mgr=new Matplot3D4JMgr(processor);

        //=======================================
        //准备你的高度数据,是一个二维Double数组。表示均匀分布的网格点,数组内的值表示高度
        //数据一般来源于具体应用的非规则函数数据,例如某区域的DEM地形高程数据
        //以下代码创造一些虚拟数据用于展示如何使用

        Double[][] datas=new Double[100][100];

        Random random=new Random();

        for(int i=0;i<datas.length;i++) {
            for(int j=0;j<datas[0].length;j++) {

                datas[i][j]=-0.1*Math.pow(100d-i-j,2)+1000;

            }
        }
        //=======================================

        //=======================================
        //准备你的显示数据values,是一个二维Double数组,。表示均匀分布的网格点,数组内的值表示非xyz的第四维标量数据
        //values的行列分布可以不与datas一致,但建议最好一致以优化显示效果
        //以下代码创造一些虚拟数据用于展示如何使用

        Double[][] values=new Double[50][50];
        for(int i=0;i<values.length;i++) {
            for(int j=0;j<values[0].length;j++) {

                    double temp=Math.sqrt(Math.pow(i-25d,2)+Math.pow(j-25d,2));

                    values[i][j]=temp;

            }
        }
        //=======================================

        mgr.setCoordianteSysShowType(Matplot3D4JMgr.COORDINATE_SYS_ALWAYS_FURTHER);

        processor.setClose3DObject(true);//设置是否是封闭三维对象

        mgr.setScaleX(5);
        mgr.setScaleY(5);
        mgr.setScaleZ(0.2);

        mgr.setTitle("Demo 二维云图");

        processor.setShowGrid(false);//是否现显示辅助网格线

        Color baseColor=Color.GRAY;//云图需要一个基色

        processor.addData(datas, values,baseColor, "my_name", new Range(0, 100), new Range(100, 200), 20, 20, 1f);

        mgr.show();
    }
}
折线:
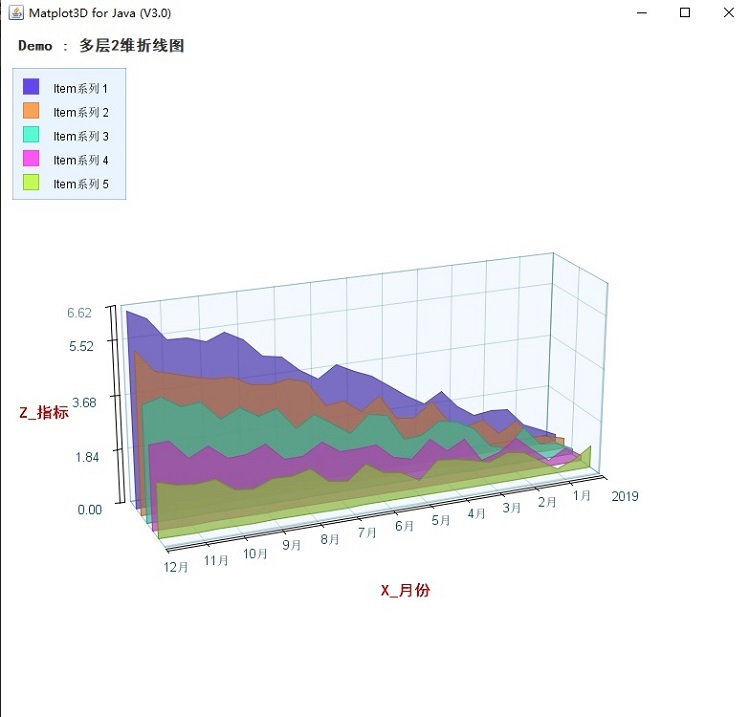
折线图示例代码
import java.awt.Color;
import java.awt.Font;
import java.awt.geom.Point2D;
import java.util.ArrayList;
import java.util.List;
import java.util.Random;

import tanling.matplot3d.app.facade.LineChartProcessor;
import tanling.matplot3d.app.facade.Matplot3D4JMgr;

public class LineChart2dsDemo {

    public static void main(String[] args) {

        LineChartProcessor processor = new LineChartProcessor();

        Matplot3D4JMgr mgr=new Matplot3D4JMgr(processor);

        Random ra = new Random();

//      int groupCount = 5;

        int pointCount = 25;

        //==================================================
        //在此准备数据
        //折线图中所有平面中二维点由Point2D.Double表示,按照顺序放入List<Point2D.Double>中
        //prepare your data here

        List<Point2D.Double>[] targets = new ArrayList[pointCount];

        // 设置最终的数据
        for (int c = 1; c <= targets.length; c++) {

            List<Point2D.Double> li = new ArrayList<Point2D.Double>();
            targets[c - 1] = li;

            for (int i = 0; i < pointCount; i++) {
                li.add(new Point2D.Double(i, i * c * 0.05 + (ra.nextDouble() * 0.8)));
            }
        }

        //将数据加入处理器
        processor.addData("Item系列 1", null, targets[0]);
        processor.addData("Item系列 2", null, targets[1]);
        processor.addData("Item系列 3", null, targets[2]);
        processor.addData("Item系列 4", null, targets[3]);
        processor.addData("Item系列 5", null, targets[4]);

        mgr.setBeita(4.3);
        mgr.setSeeta(0.3);

        mgr.setScaleY(1);
        mgr.setScaleX(1);
        mgr.setScaleZ(1.6);// 拉伸Z方向,使图形显得更高

        mgr.setTitle("Demo : 多层2维折线图");

        mgr.setRulerYVisable(false);

        mgr. setXName("X_月份");
        mgr. setZName("Z_指标");

        mgr. setRulerTextColor(new Color(11, 79, 107));
        mgr. setRulerTextFont(new Font("方正正楷", Font.PLAIN, 13));

        mgr. setAxisNameTextColor(new Color(138, 171, 205));

        // 自定义标尺(使标尺不使用默认的数量进行显示)
        String[] labels = new String[13];
        double[] positions = new double[13];

        labels[0] = "    2019    "; // 加入空格会扩大文字和标尺的距离
        positions[0] = 0;

        for (int i = 2; i < pointCount; i += 2) {
            labels[i / 2] = i / 2 + "月";
            positions[i / 2] = i;
        }

        mgr. setRulerLabelsX(labels, positions);//设置X方向标尺自定义可读文字

        mgr. setRulerYVisable(false);//不显示Y方向标尺

        mgr. setCoordianteSysShowType(Matplot3D4JMgr.COORDINATE_SYS_STABLE);

        mgr.show();
    }
}
柱状图:
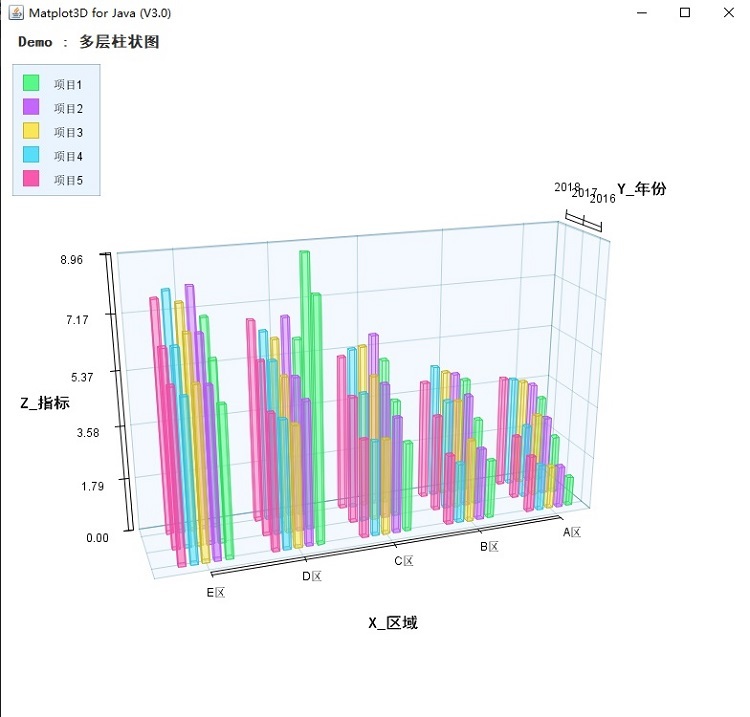
柱状图示例代码
import java.util.Random;

import tanling.matplot3d.app.facade.HistogramProcessor;
import tanling.matplot3d.app.facade.Matplot3D4JMgr;

public class BarsDemo {

    public static void main(String[] args) {

        HistogramProcessor processor = new HistogramProcessor();

        Matplot3D4JMgr mgr=new Matplot3D4JMgr(processor);

        //===========================================
        //在此准备数据
        //每组数据在一个或多个二维数组中,数组中表示柱体高度(标1表示组号,相同组号同颜色;下标2表示同组中的不同列)
        //prepare your data here

        Random ra=new Random();
        double[][] ds1 = new double[][] { { 3, 4, 5, 6, 7 }, { 2, 3, 4, 9, 6 }, { 1, 2, 3, 8, 5 } };

        double[][] ds2 = new double[][] {
                { 3 + ra.nextDouble(), 4 + ra.nextDouble(), 5 + ra.nextDouble(), 6 + ra.nextDouble(),
                        7 + ra.nextDouble() },
                { 2 + ra.nextDouble(), 3 + ra.nextDouble(), 4 + ra.nextDouble(), 5 + ra.nextDouble(),
                        6 + ra.nextDouble() },
                { 1 + ra.nextDouble(), 2 + ra.nextDouble(), 3 + ra.nextDouble(), 4 + ra.nextDouble(),
                        5 + ra.nextDouble() } };

        double[][] ds3 = new double[][] {
                { 3 + ra.nextDouble(), 4 + ra.nextDouble(), 5 + ra.nextDouble(), 6 + ra.nextDouble(),
                        7 + ra.nextDouble() },
                { 2 + ra.nextDouble(), 3 + ra.nextDouble(), 4 + ra.nextDouble(), 5 + ra.nextDouble(),
                        6 + ra.nextDouble() },
                { 1 + ra.nextDouble(), 2 + ra.nextDouble(), 3 + ra.nextDouble(), 4 + ra.nextDouble(),
                        5 + ra.nextDouble() } };

        double[][] ds4 = new double[][] {
                { 3 + ra.nextDouble(), 4 + ra.nextDouble(), 5 + ra.nextDouble(), 6 + ra.nextDouble(),
                        7 + ra.nextDouble() },
                { 2 + ra.nextDouble(), 3 + ra.nextDouble(), 4 + ra.nextDouble(), 5 + ra.nextDouble(),
                        6 + ra.nextDouble() },
                { 1 + ra.nextDouble(), 2 + ra.nextDouble(), 3 + ra.nextDouble(), 4 + ra.nextDouble(),
                        5 + ra.nextDouble() } };

        double[][] ds5 = new double[][] {
                { 3 + ra.nextDouble(), 4 + ra.nextDouble(), 5 + ra.nextDouble(), 6 + ra.nextDouble(),
                        7 + ra.nextDouble() },
                { 2 + ra.nextDouble(), 3 + ra.nextDouble(), 4 + ra.nextDouble(), 5 + ra.nextDouble(),
                        6 + ra.nextDouble() },
                { 1 + ra.nextDouble(), 2 + ra.nextDouble(), 3 + ra.nextDouble(), 4 + ra.nextDouble(),
                        5 + ra.nextDouble() } };


        processor.addData("项目1", ds1);
        processor.addData("项目2", ds2);
        processor.addData("项目3", ds3);
        processor.addData("项目4", ds4);
        processor.addData("项目5", ds5);

        mgr.setTitle("Demo : 多层柱状图");

        //可进行相对线度显示比例调整,即一个逻辑长度可以对应不同的显示长度
        mgr.setScaleZ(8);
        mgr.setScaleX(1.2);
        mgr.setScaleY(2);

        mgr.setSeeta(0.3);//观察的初始俯仰角
        mgr.setBeita(1.2);//观察的初始方位角

        //自定义区标签,数量与组数对应
        mgr.setRulerLabelsX(new String[] { "A区", "B区", "C区", "D区", "E区" });
        mgr.setRulerLabelsY(new String[] { "2018", "2017", "2016" });

        //列方向标签
        mgr.setXName("X_区域");
        mgr.setYName("Y_年份");
        mgr.setZName("Z_指标");

        //坐标系平面空间位置稳定
        mgr.setCoordianteSysShowType(Matplot3D4JMgr.COORDINATE_SYS_STABLE);

        mgr.show();
    }

}
